Platform Applications Knowledge Base Human in the Loop Roadmap Schedule a demo →
GEN AI FOR SUBSURFACE

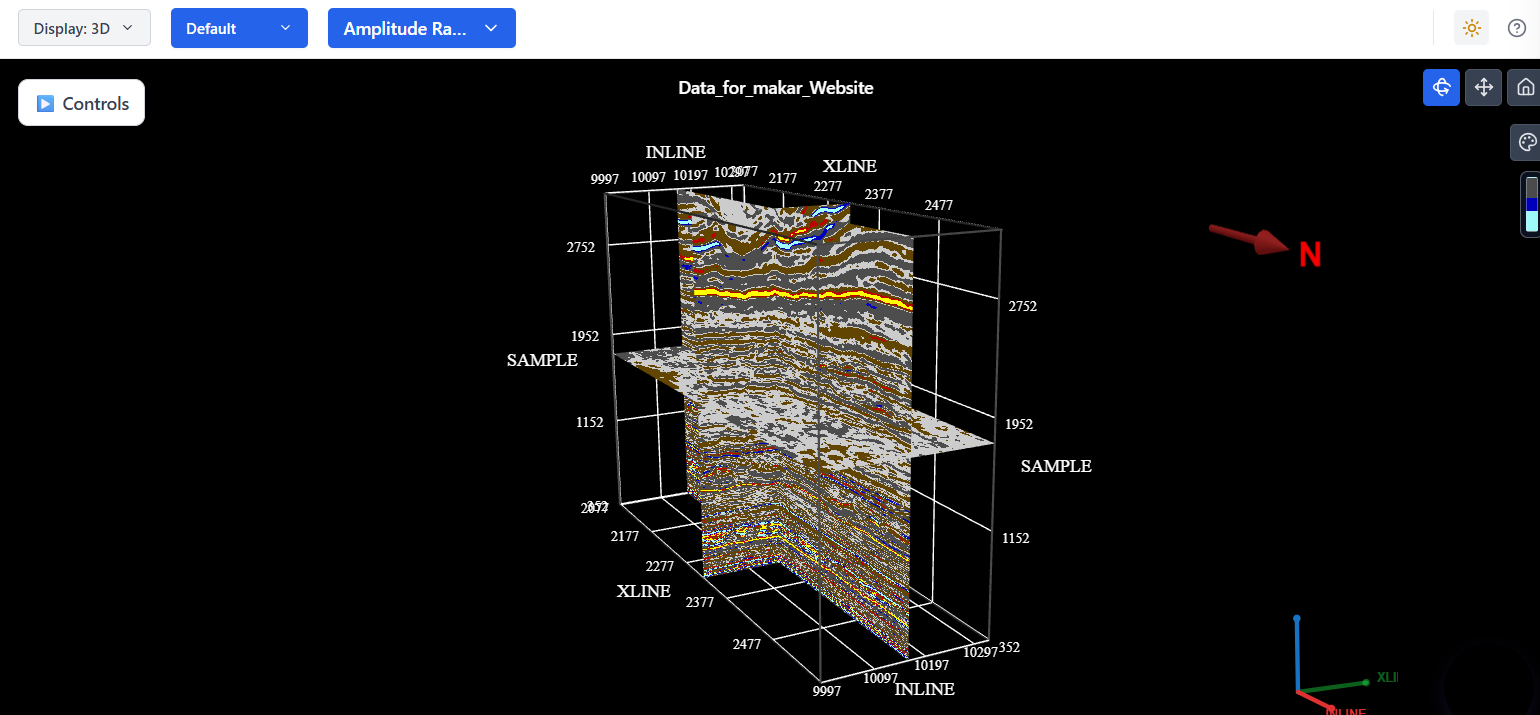
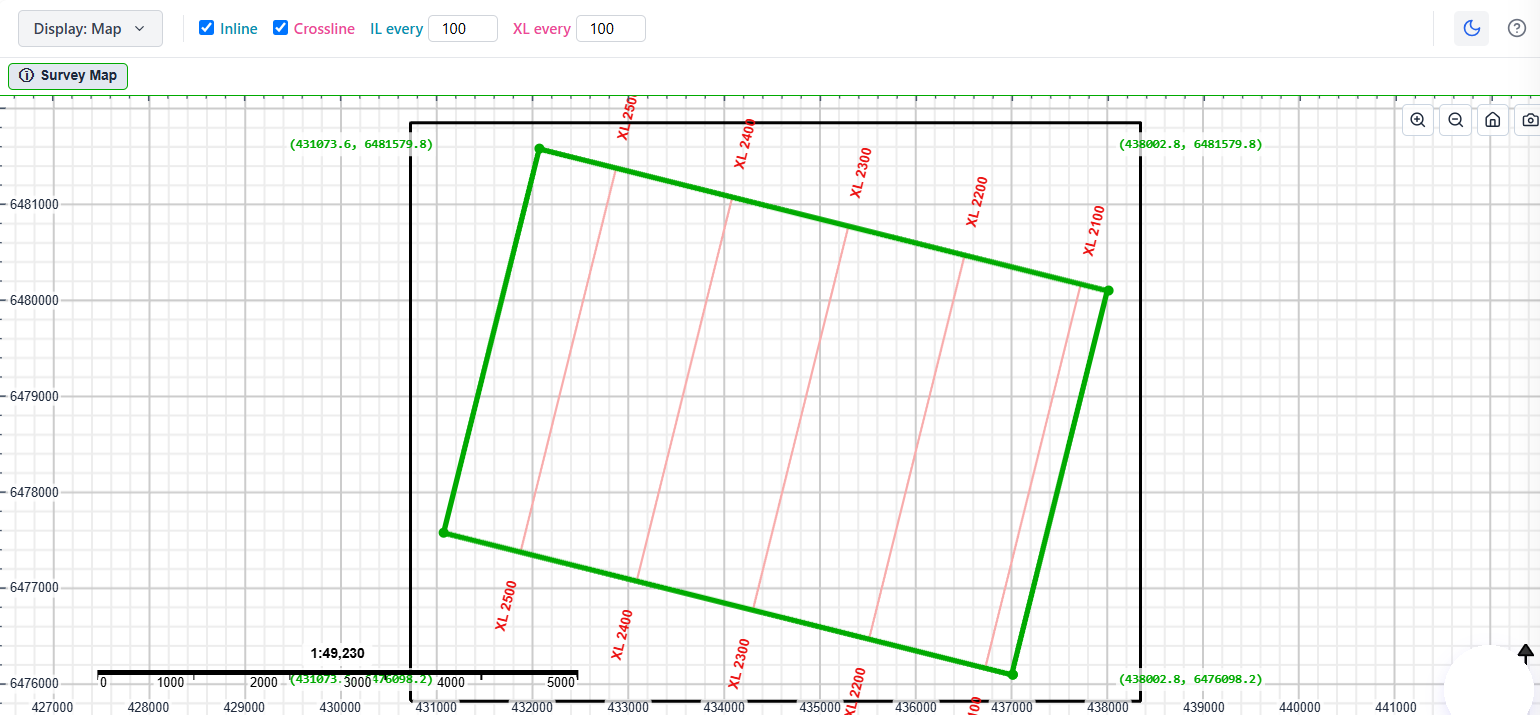
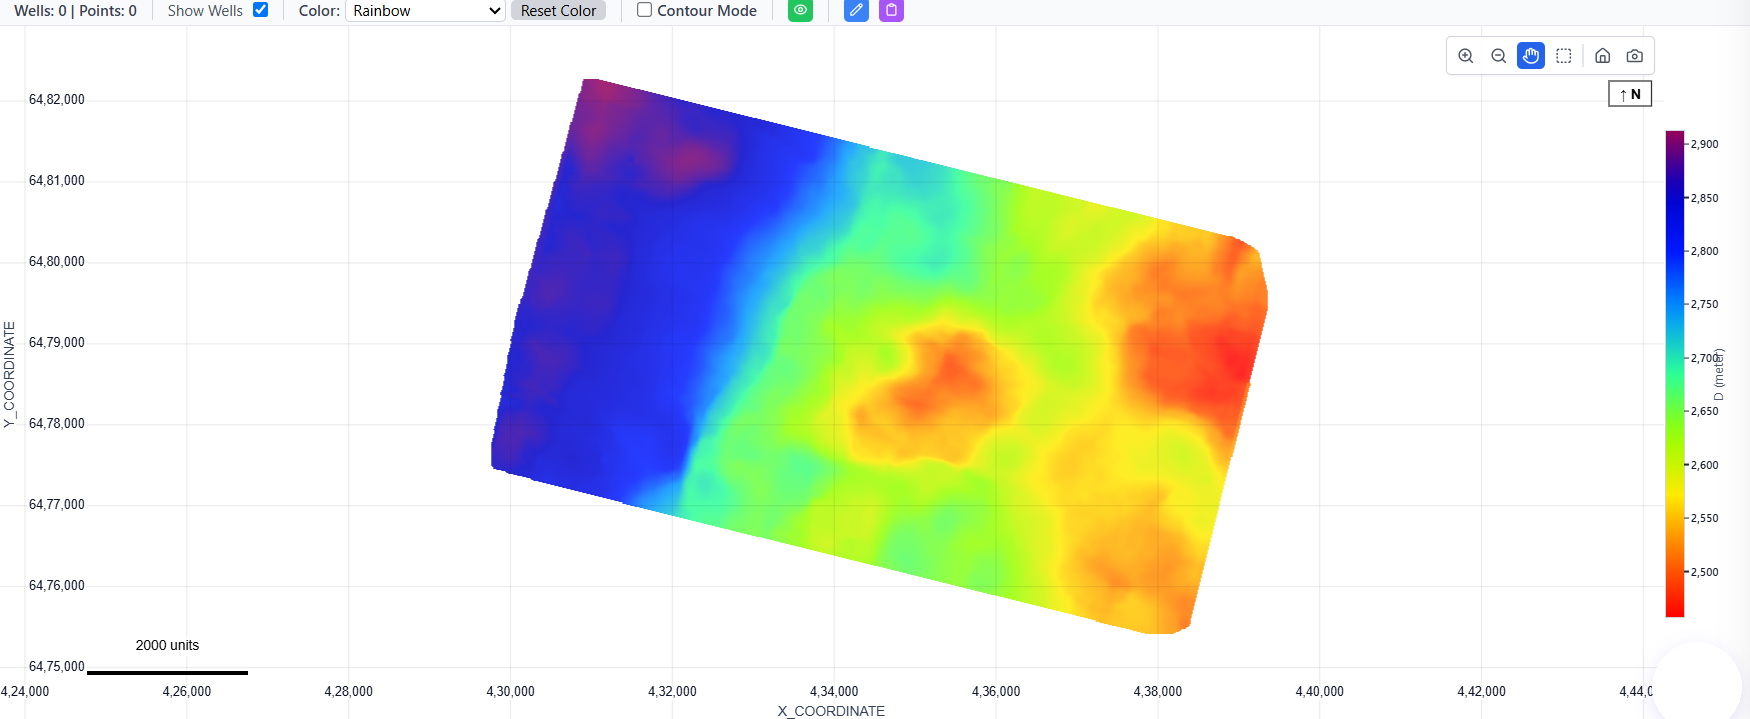
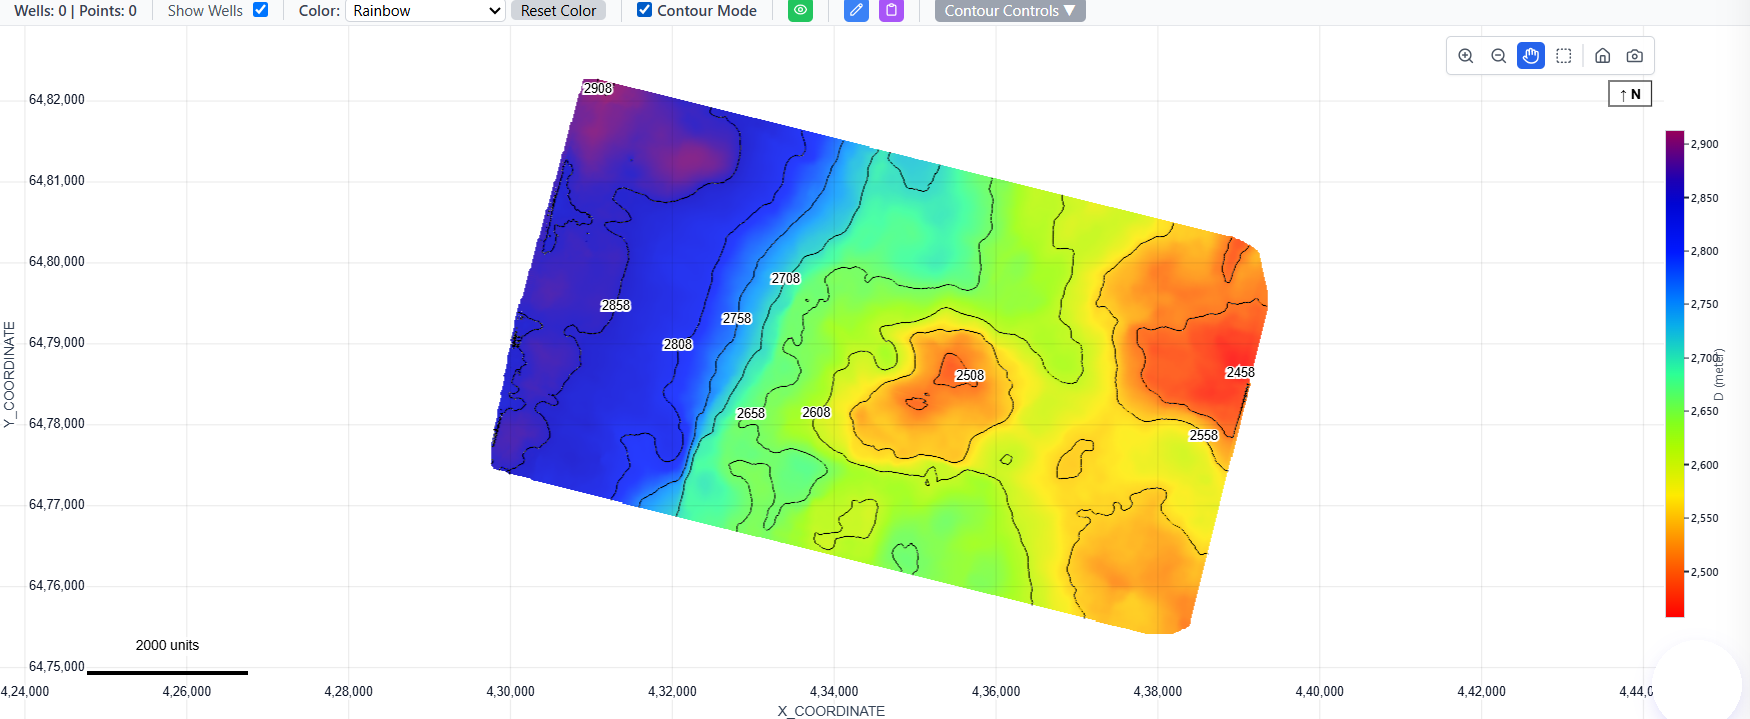
From Seismic to reservoir, in one environment

Every app, every agent and a permanent knowledge base on one shared model — so an interpretation made in seismic is still answerable from reservoir, three years later.

Seismic Geology Petrophysics Reservoir Production
  • Weeks → hoursScreening, rock typing and static models in a session, not a study cycle.
  • Your formats, both waysLAS, DLIS, SEG-Y, GRDECL and EGRID in. Petrel, Eclipse and RMS open what comes out.
  • Nothing leaves the loopEvery model, report and interpretation stays queryable in plain language.
  • Assurance built inPeer review, timestamped approvals and a full audit trail.
PLATFORM

From a messy folder to a decision you can defend

Four modules get your data in, on screen, worked and answerable. Three app families do the science on top — seismic, geology, reservoir.
One project underneath all of it, so nothing has to be exported, re-imported or explained twice.

One project · one model · one audit trail · everything above reads and writes here

01 Data

analAIz

Smart Upload takes every subsurface format in one pass — classified, organised, validated and de-duplicated on arrival.

SGYSEGY LASDLISFMTDEVASCII TXTDATTMP CSVXLSXXLS EGRIDGRDECLGSLIB PDFDOCDOCXPPTPPTX no extension Formats accepted No extension? The file is identified from its content, not its name.
Project folder · raw drop
  • LASA-12_triple_combo.las
  • DEVA-12_deviation.dev
  • SGY3D_migrated_full.sgy
  • SGY3D_migrated_full(1).sgy
  • ?top_reservoir_pick
  • FAULTF_block_east.fault
  • HORIZONH_top_sand.hrz
  • GRDECLstatic_grid.grdecl
  • XLSXproduction_history.xlsx
Uploading 0/ 100

Duplicate3D_migrated_full(1).sgy matches 3D_migrated_full.sgy, already on file

100 files · mixed formats · unsorted
Smart Uploadone pass
  • Classify
  • Organise
  • Validate
  • De-duplicate
Classified · validated · de-duplicated
Total
0
Originals
0
Duplicates
0
Corrupted
0
  • File typeTotalOrigDupCorr
  • Seismic SGY0000
  • Horizon HORIZON0000
  • Fault FAULT0000
  • Polygon POLYGON0000
  • Deviation DEV0000
  • GridECL GRDECL0000
+ 8 more types · 100 files total
03 LLM

Intellifetch

Data Intelligence

Reads the data, not a description of it

Ask about a number and Intellifetch opens the file, reads the curves over the interval you named and computes the answer — then shows the plot it came from, so the figure can be checked rather than taken on trust.

  • Reads LAS, DLIS, CSV and Excel directly
  • Computes over the interval you name
  • Returns the figure and the plot behind it
Data Intelligence
You

What is the total cumulative oil for well-02?

The total cumulative oil for well-02 is 11,584,920.691.

well-02cumulative oil
You

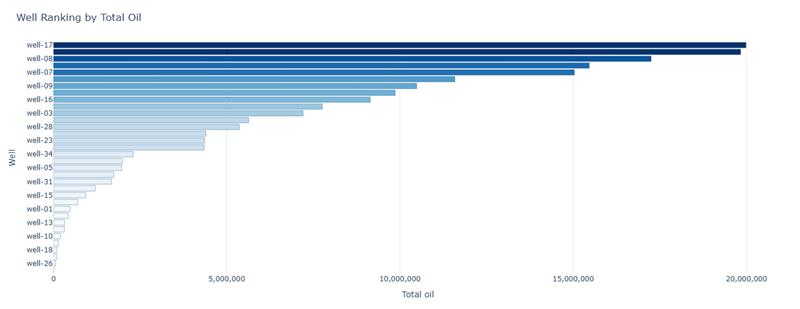
Rank all the wells by total oil as a bar chart.

Here is the ranking, highest first.

Bar chart, Well Ranking by Total Oil: well-17 highest at about 20 million, then well-08, well-07, well-09 and well-16, down to well-26 at almost none.
You

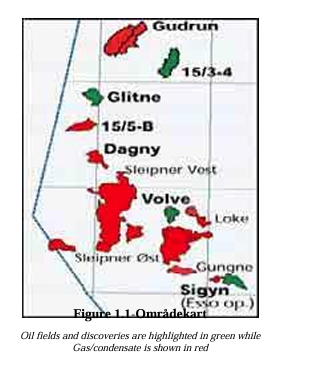
Where is the Volve field located? Can you give me a map of it?

Here is the area map, taken from the field document.

Area map from the Volve document: oil fields and discoveries highlighted in green, gas and condensate in red, with Volve, Sleipner Vest, Sleipner Øst, Gudrun, Glitne, Dagny, Loke, Gungne and Sigyn labelled.
Source1
Volve_PUD_English_1.pdf
Image Source1
Volve_PUD_English_1.pdf
You

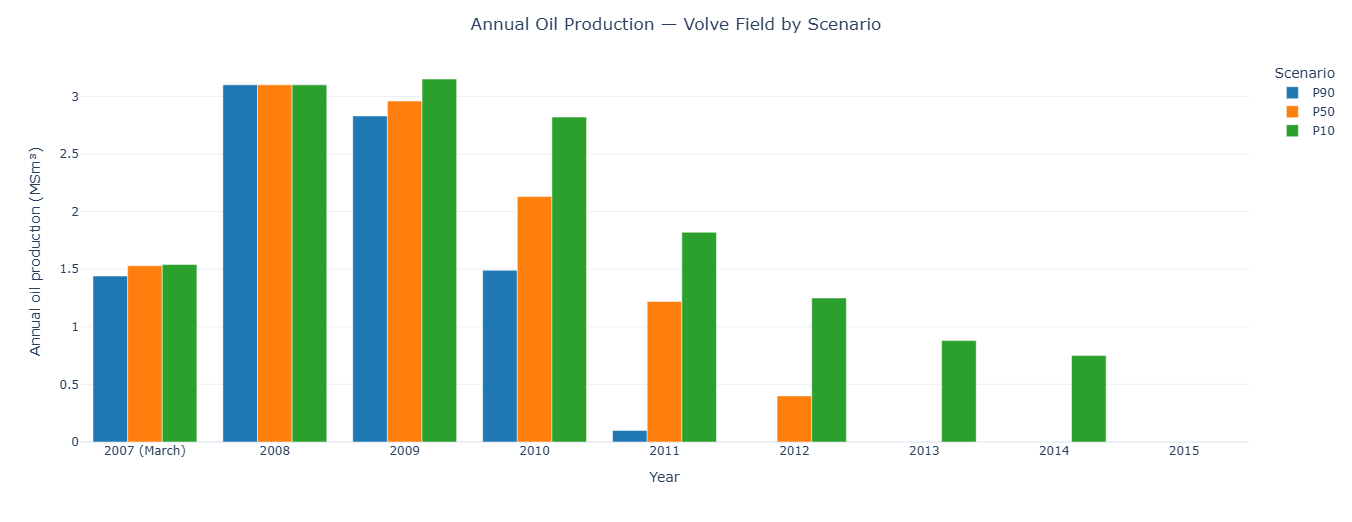
Create a bar chart comparing the annual oil production (in MSm³) for the Volve field across the P90, P50, and P10 scenarios from 2007 to 2015.

Here is the annual oil production for P90, P50 and P10, 2007 to 2015.

Bar chart, Annual Oil Production, Volve Field by Scenario, in MSm³ from 2007 to 2015: all three scenarios start near 1.5 and peak at about 3.1 in 2008 and 2009, then P90 falls to zero by 2012, P50 by 2013 and P10 by 2015.
You

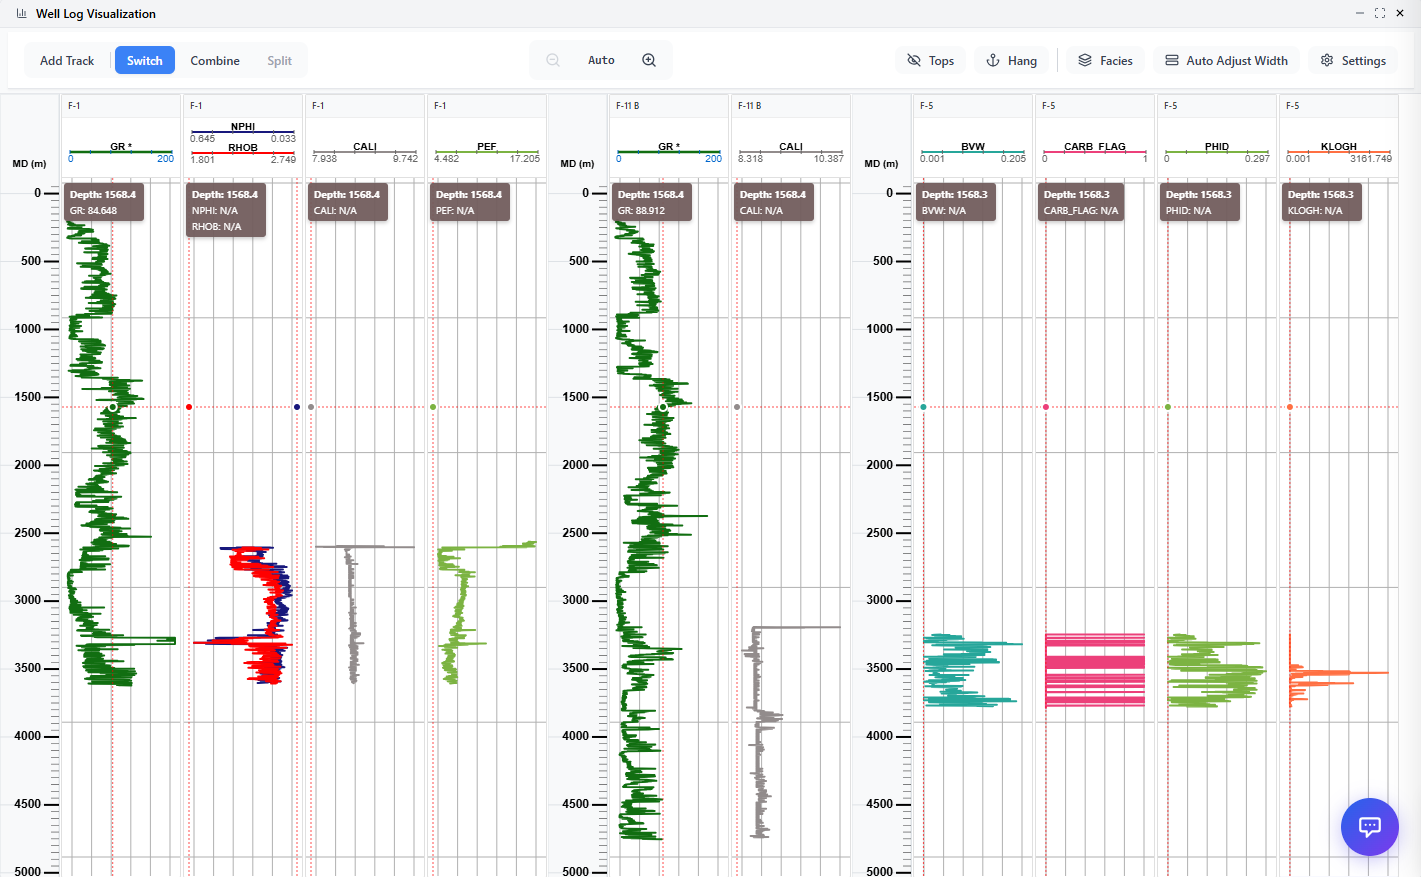
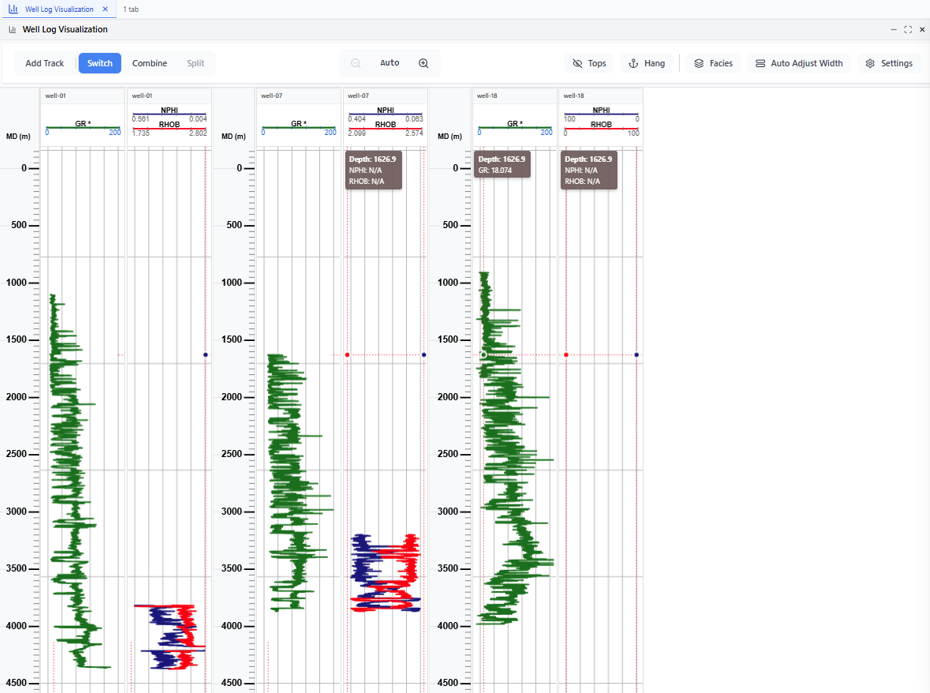
Plot GR, NPHI, RHOB of well-01, well-07, well-18

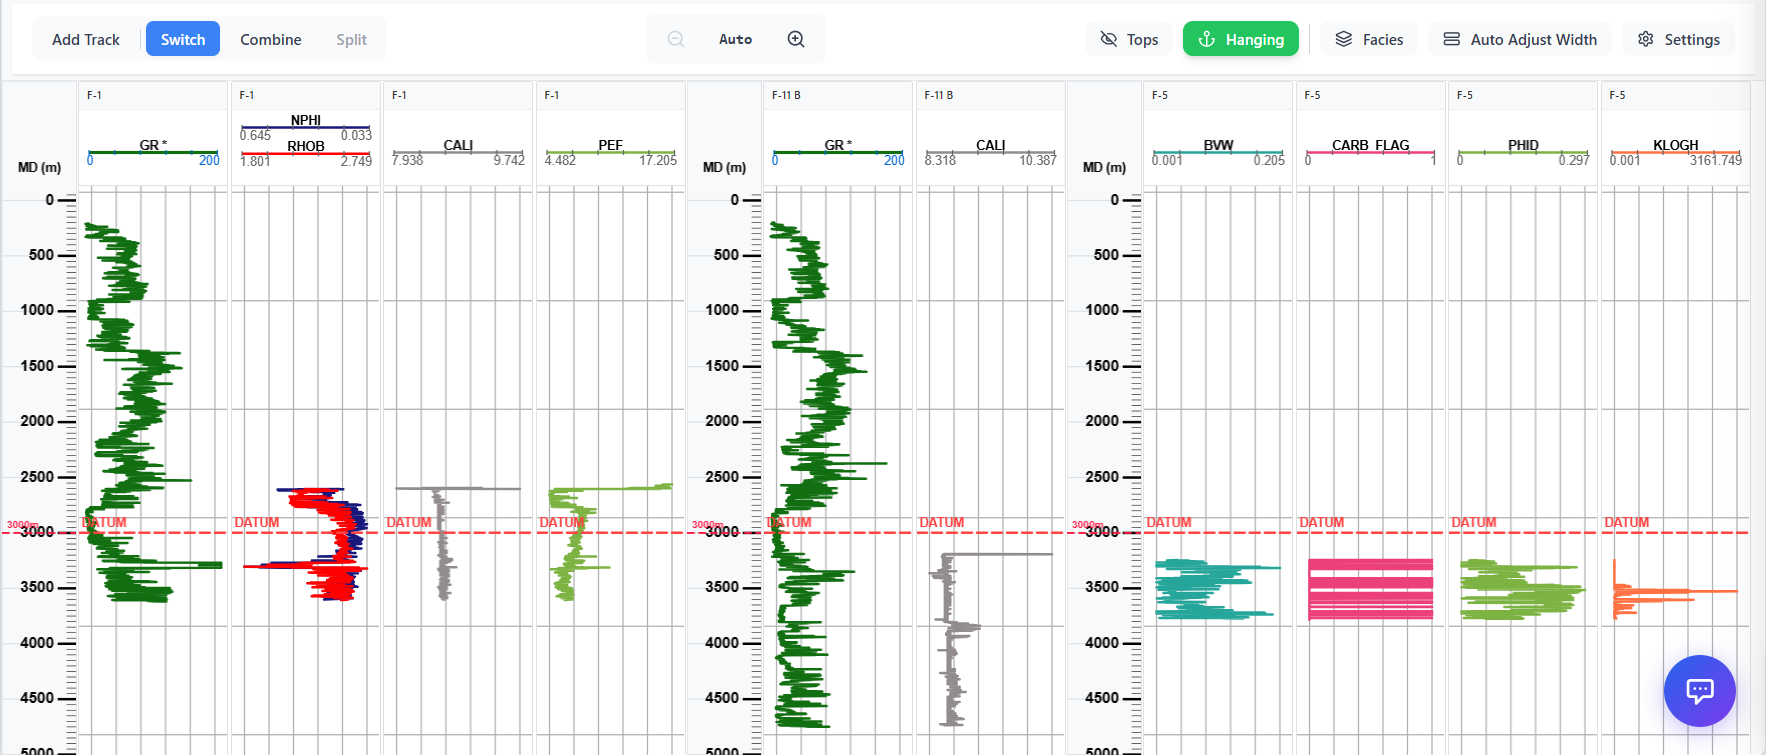
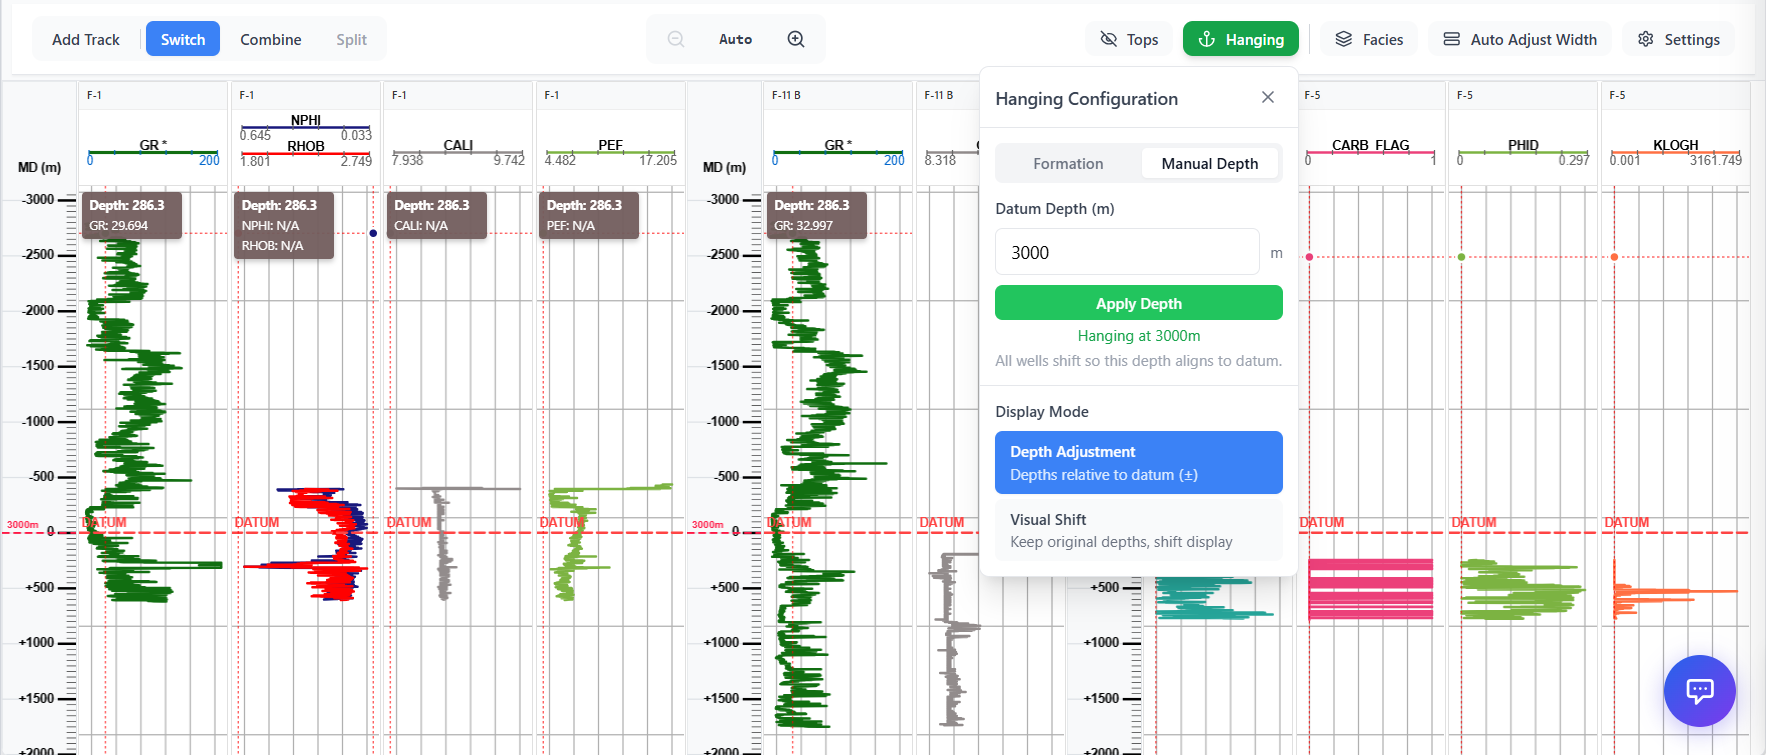
Done on the platform: GR, NPHI and RHOB for the three wells are open in the viewer beside this chat.

well-01well-07well-18GR · NPHI · RHOB
You

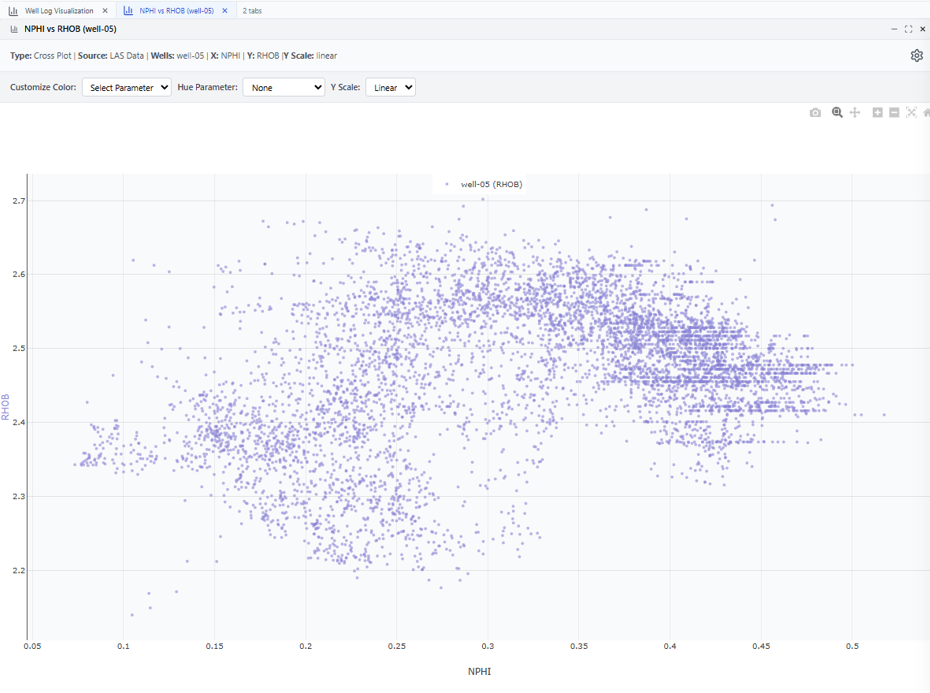
Give Cross Plot for NPHI vs RHOB for well-05

Cross plot of NPHI against RHOB for well-05, from the LAS data, opened as a new tab.

well-05LAS DataNPHI × RHOB
You

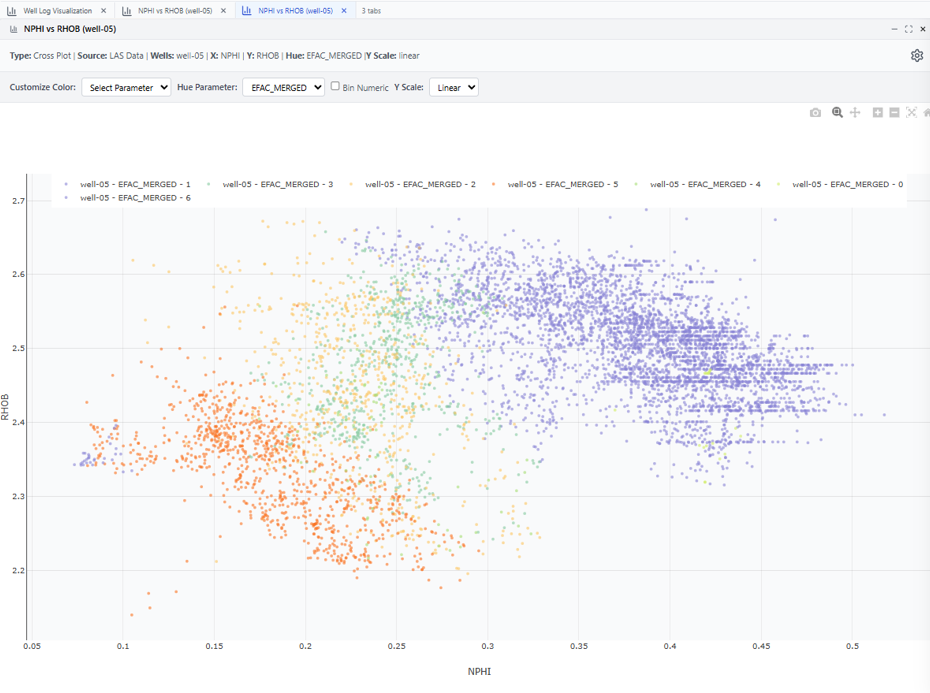
add EFAC_MERGED as hue

Same cross plot, now coloured by EFAC_MERGED.

EFAC_MERGEDhue
You

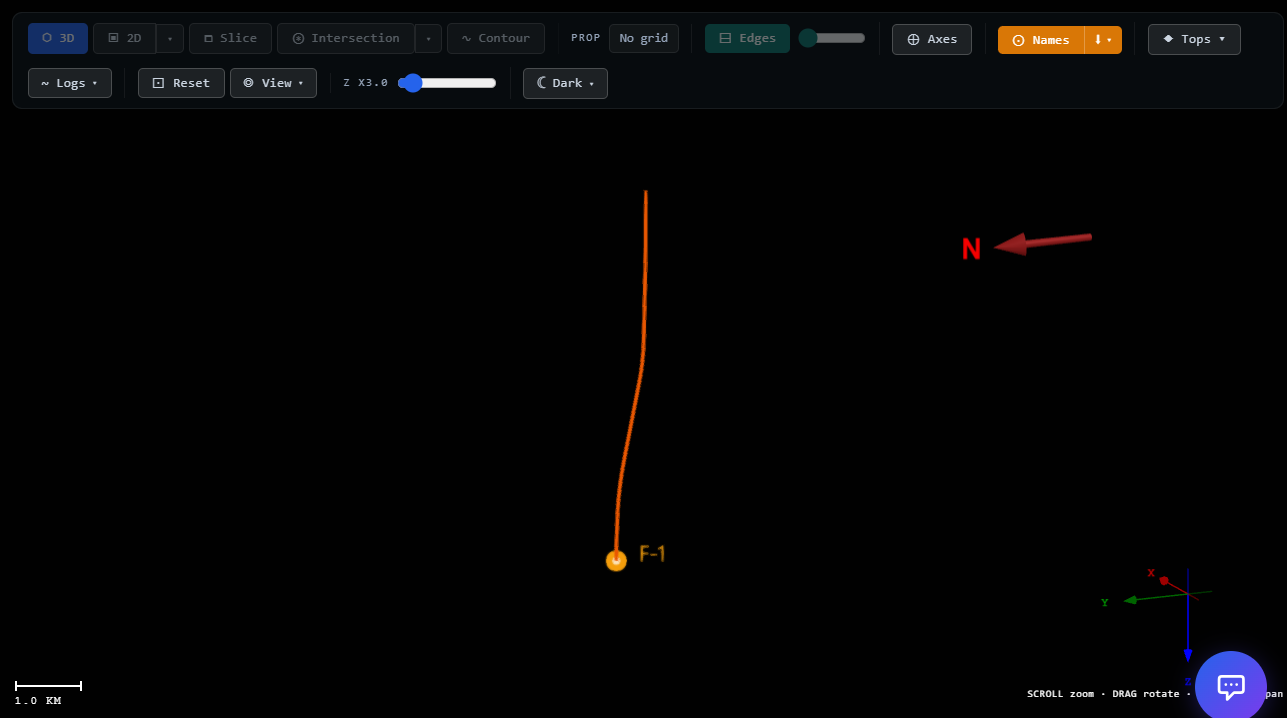
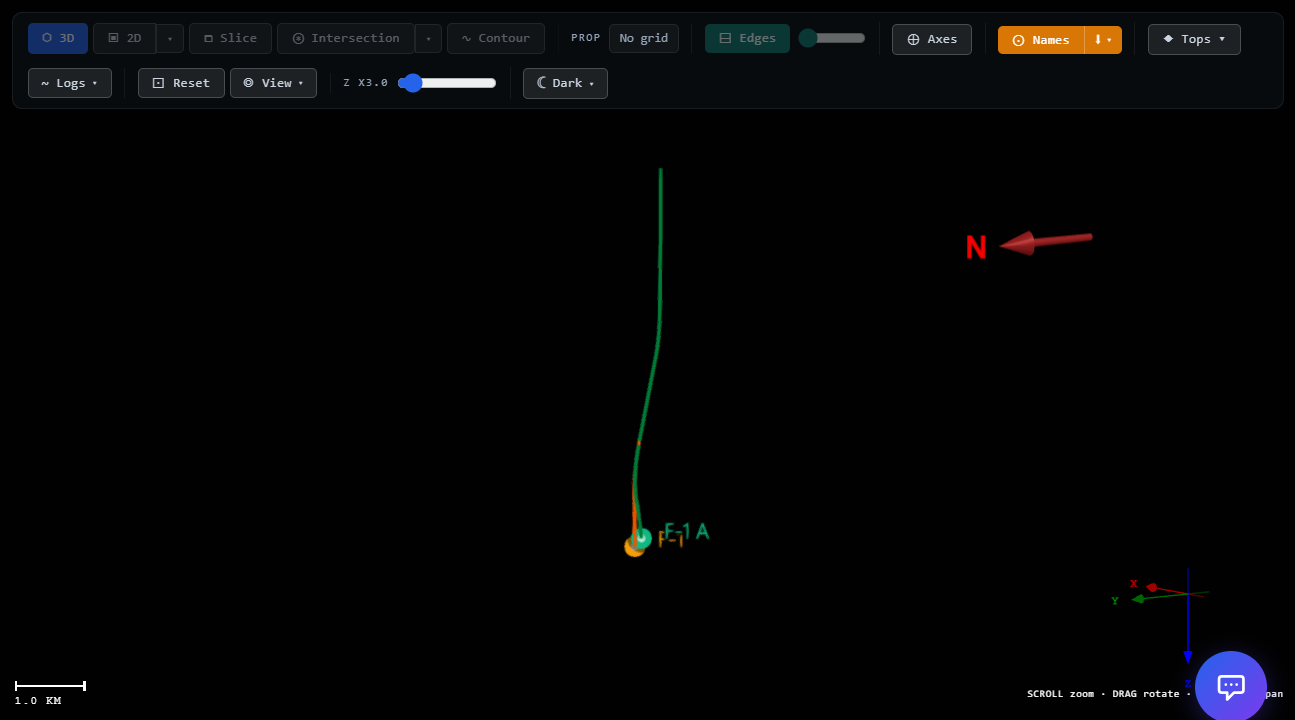
Draft the petrophysics section for the F-1 review.

Drafted in your review template — 1,180 words, four figures and two tables, pulled from the live project. Every number links back to the run that produced it.

  1. 1Log coverage and quality1 table
  2. 2Petrophysical interpretation2 figures
  3. 3Reservoir summary by zone1 table, 2 figures
F-1_review.docxtracedWord — PDF
Your reportsYour modelsYour data → ANSWERS WITH SOURCES
YOUR KNOWLEDGE BASE

Every study you've run, retained, governed and queryable.

Subsurface data usually outlives the project that produced it, but its context rarely survives. Seismic interpretations, well correlations, static and dynamic models, and the reasoning behind them end up spread across local drives and legacy folders, and the next team can't easily use them. Makar brings them together in one governed repository with full metadata and provenance. Every record can then be queried in plain language through Intellifetch, so past work keeps paying back.

01

Persistent & versioned

Raw data, models, reports and interpretations are kept with full version history and provenance. Every conclusion can be traced back to its inputs, long after the project closes or its author moves on.

02

Secure, role-based access

Authorised engineers, managers and auditors can open any project from any location. Access follows role-based permissions and every action is logged. There are no file requests and no searching network drives.

03

Structured & discoverable

Data is catalogued by asset, project and discipline (seismic, wells, petrophysics, geology, reservoir, production) and tagged with metadata. People find it by what it contains, not by guessing folder names.

04

Cross-project intelligence

Analogues, lessons learned and calibrated parameters from one basin or asset feed into the next. Expertise builds up across the portfolio instead of being worked out again for every study.

Less time searching for data. Faster studies. Decisions you can defend and audit.

Coming soonWe’re putting the finishing touches to it.